So What's it Going To Be?
Harry Crane's final 2024 election prediction, and how he came up with it
On the morning of election day, my 2024 presidential election model forecast stands at:
Trump: 66.5%
Harris: 33.1%
These numbers align with the 61% forecast in Trump’s favor that I shared on September 1, which has remained mostly steady since its initial release in July. This projection reflects Trump’s perceived edge in a combination of factors, including fundamentals, polls, and early voting, all of which are either very favorable or neutral for Trump according to the model.
For a comparison, the current Polymarket odds, as of the time of writing this, give Trump a 63% chance, compared to Harris’s 37%.
Kalshi, Betfair, and other markets all point in the same direction, but lag a bit behind at 59% (Kalshi) and 61.7% (Betfair), respectively.
The poll aggregators, by comparison, are more neutral on the race, hovering right around the 50-50 mark as the race comes to a close. The Silver Bulletin gives Trump a 49.6% chance (compared to Harris at 50.0%), while Metaculus and Manifold give Trump 49.0% and 49.4%, respectively. (It’s an open question how much “herding” — to borrow a phrase — is in these forecasts.)
All of this can be viewed easily in the Super Model’s Presidential market aggregator, which tracks all of the major betting markets and forecasters in real time.
Below, I break down all of these different projections, try to explain how and why they differ, and also give a sneak peak into how the model arrives at its forecast.
Why has the forecast been so stable?
Something that stands out about the model probabilities given here that differs from other poll-based forecasts is its stability over time. Unlike other well-known forecasts, which have been bouncing back and forth between 40-60% on each candidate over the past several months, this forecast has been more stable because it uses inputs from multiple sources (not just baseline demographics and polls) and also modifies the relative importance of each data source throughout the election cycle based on which information source is more relevant at a given time.
Generally, the key information sources for the model are:
Fundamentals
Polls
Early Voting Data
Fundamentals include indicators such as economic conditions, approval ratings, right track/wrong track assessments, voter registration, demographics, and other baseline metrics. Early voting data contains information about party-level turnout in early voting, for those states in which it is available. Poll data is self-explanatory.
The importance of each data source varies throughout the three main stages of the election cycle,
Pre-Convention (before mid-September): The forecast is heavily weighted toward fundamentals during this stage. This is the period during which there is the most uncertainty, as the candidates are not even set in stone (as illustrated throughout June and July 2024 in both parties) and many voters have not yet started paying attention, making the polling data unreliable. During this stage, the forecast relies almost entirely on fundamentals.
Campaign (mid-September to late-October): From about mid-September until late-October, only after the “convention bounce” works its way out of the polls, does the forecast shift towards polls being the predominant factor. The relative importance of polls during this period increases steadily from very low importance in early September to becoming the main factor in the model by late October.
Early Voting (final week before election): Early voting data allows us to refine estimates in the fundamentals and the polls, particularly as it relates to turnout and enthusiasm.
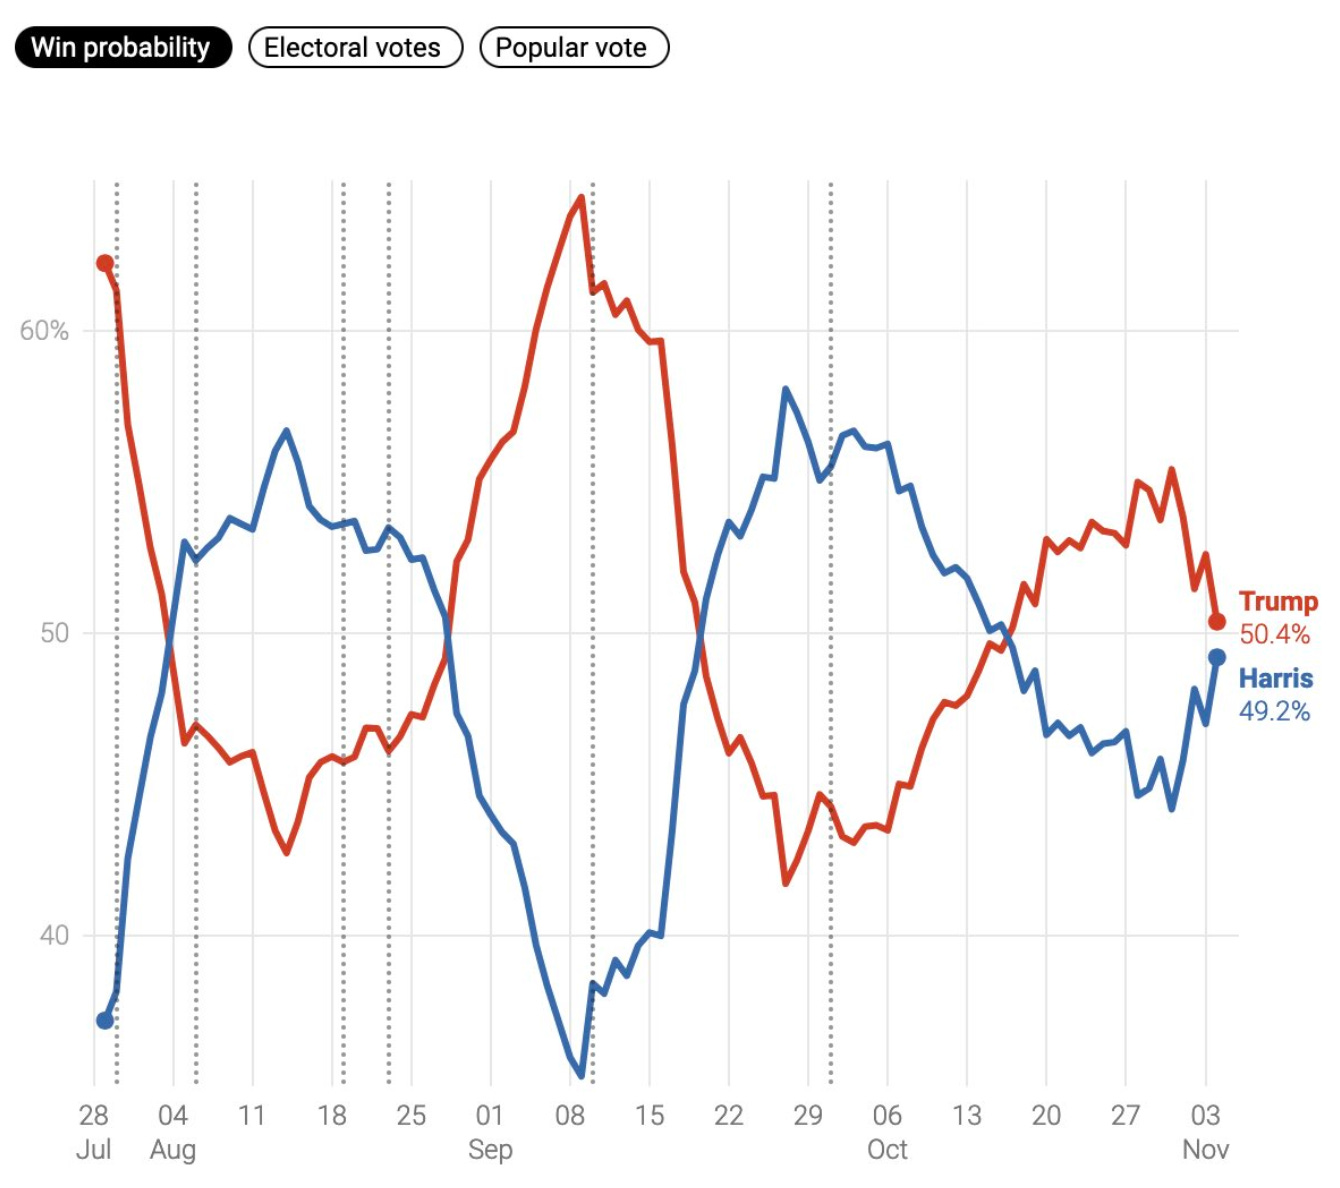
Combining information from these different sources makes the model forecast relatively stable, instead of looking like this graph from the Silver Bulletin.
As I’ve said elsewhere, the above chart reflects more noise than signal, but it’s a very good way to gain attention for a model that (as I predicted) was going to settle at 50-50.
The Infamous "Unallocated Probability"
Early projections from the model featured probabilities that added up to less than 100%. For example, on August 4, the model forecast was:
Trump: 48.0%
Harris: 28.5%
Unallocated: 23.5%
Internet naysayers and trolls took offense with the large “unallocated” probability. But the idea really shouldn’t be all that strange, especially to those familiar with betting markets. In sports betting, for example, when the odds are posted as -110 / -110, the implied probabilities on either side are 47.6% / 47.6% with 4.8% unallocated, from the book’s perspective.
The same principle applies here. Unallocated probability reflects uncertainty in the forecast. That uncertainty is highest in the pre-convention stage, and steadily decreases throughout the campaign and early voting stages. Roughly speaking, the unallocated amount is between 20-25% in the pre-convention and gradually decreases to around 1-2% by the end of the campaign.
Why not just pro-rate the uncertainty across all the possibilities? Indeed, this is what other forecasts are doing, whether they realize it or not. But there’s a big problem with this approach, especially from a betting respective.
The problem with this approach is it conflates epistemic uncertainty with randomness. That’s a whole can of worms that I can’t get into here. But in a nutshell, the probabilities on heads and tails for a fair coin are 50% each. But what about a two-sided coin that you don’t know whether its a normal coin, or whether both sides are heads or both sides are tails? For a 2-headed coin, the probability of heads is 100%, and for a 2-tailed coin the probability of heads is 0%. Because we don’t know the composition of the coin, we might be tempted to say that it’s 50% to land heads (i.e., 1/3 of time it’s a true fair coin, 1/3 it has 100% chance of heads, and 1/3 it has 0% chance of heads). And there’s a sense in which this is “correct”. But the problem arises when trying to use this probability in the real world, especially in a betting context. If we settle on the 50/50 probability but come across a market offering 2-1 odds on Heads, then our model suggests a bet on heads. But this is precisely what would happen if the person offering the bet knows more than we do, meaning we’re likely taking a bad bet. We’d be better off sitting it out than guessing.
The same logic also applies to modeling real world events, like elections. In fact, the logic is even more important in this situation, because the various factors involved make modeling more complex. So when the model asserts that Trump / Harris at 48.0 / 28.5 on August 4, it means that Trump is a buy (in the betting markets) at a price below $0.48 while Harris is a buy at a price below $0.285. At that time, both candidates were trading above their respective maximum buy prices, and therefore the model suggested no bet. The alternative of splitting the uncertainty equally would yield a forecast of 59.8 / 40.2 on Trump / Harris, respectively. Pro-rating the uncertainty would yield 62.7 / 37.3. Neither approach is sound because, by nature of the “uncertainty”, we don’t know where it should be allocated. It could all be allocated to Trump or all to Harris, or something in between. In fact, in the above situation, a disproportionate amount of the uncertainty was likely to accrue to Harris precisely because she was a relatively lesser known candidate at the time, who had not even chosen a VP and had not officially been given the nomination. And it turns out, that’s exactly what eventually happened once this uncertainty was resolved.
So what’s it going to be?
With all that said, to retierate, the model’s final projection is:
Trump: 66.5%
Harris: 33.1%
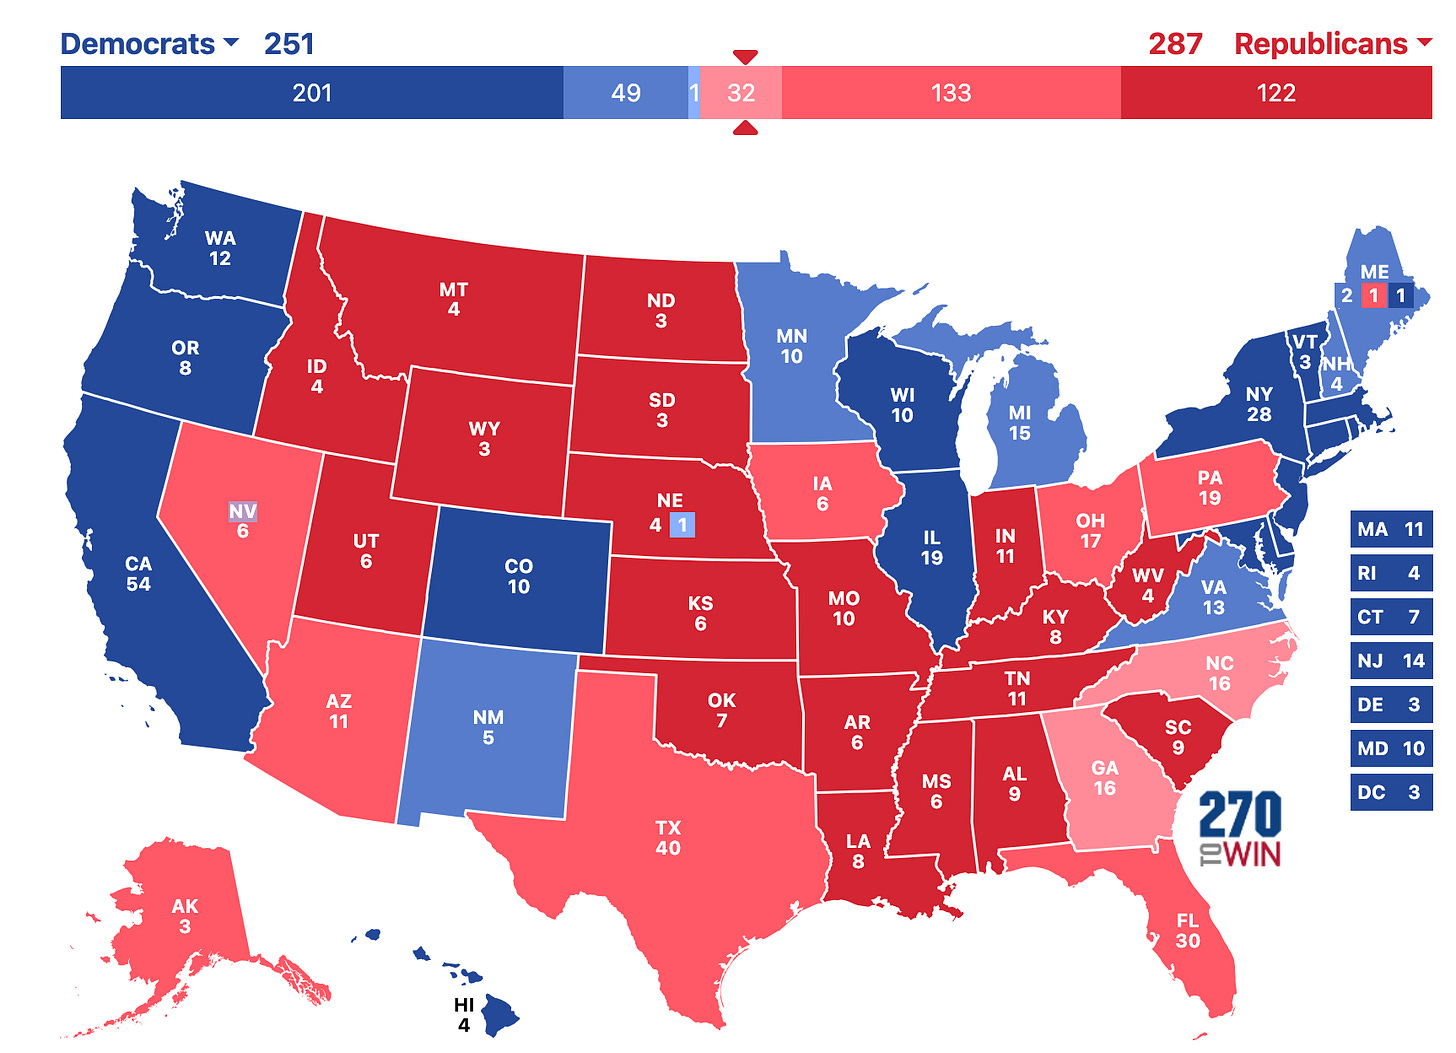
With an "average" electoral college projection that looks like this.
Note that this specific map is not very likely to occur. This map shows the projection if we predict each state based on which candidate has the highest probability in that state, but as I’ve discussed elsewhere the individual states do not behave independently of each other. If one of the swing states breaks for Trump, then it is more likely that all of them will. If one of the swing states goes to Harris, then it is more likely that the others will as well.
Because of these correlations between states, the map is more likely to be much redder…
…or much bluer…
..with a possibility of a landslide that might look like this:
To be clear, the above landslide map is a relatively remote possibility at the extreme end of possibilities for Trump. The probability that all of New Hampshire, Minnesota, and Virginia go for Trump is unlikely. Of these, New Hampshire is the most likely to go to Trump (around 22%), while the others are closer to 10%. I include this map to point out how the correlations could swing the election one way or the other in a dramatic way, and that all of those results are consistent with the race currently being “close”.
Why Trump holds the edge according to my model
As laid out above, the model uses information from fundamentals, polls, and early voting. The fundamentals-only forecast, as of September 1, gave Trump 61% based on low approval of the incumbent party (the RealClearPolitics average shows that 62.9% believe the country is on the wrong track compared to only 27.0% on the right track) and voter registration trends with Republicans cutting into the Democrat margin in a number of states (e.g., in Pennsylvania, Democrats have a 358,000 voter advantage in 2024 versus a 685,000 voter advantage in 2020; in Iowa, Republicans held a 20,000 voter advantage in 2020, versus a 173,000 voter advantage in 2024; and similar trends hold across other key states). Of course, we don’t know how many of these registered voters will vote, nor do we know which candidate they will vote for. This explains why the fundamentals-only model gives only a 61% chance to Trump, despite significant advantage according to these numbers.
After fundamentals, the polling is a bit closer but still leans toward Trump in all of the key states, except Wisconsin and Michigan, as can be confirmed by looking at both the polling averages, the betting markets, and the other model based forecasts, which rely almost entirely on polls. Our polls-only forecast is moderated compared to the fundamentals-only forecast, giving Trump just 54.1%. Other forecasters are closer to 50/50, with many giving Harris a slight advantage. I suspect the reason for the difference is in how certain polls are weighted, and on whether the model uses only the top-line poll results or corrects the top-line as part of the model. Most forecasters seem to take the top-line values at face value, avoiding the practice of “crosstab diving”, which Nate Silver equates to astrology. On this point, I mostly agree with Silver. Digging into a poll to find that a candidate is “winning young, white, college educated male” voters is not useful, and I don’t recommend it. Where I depart from this is that the top-line numbers are usually OK but sometimes are misleading in a significant way, because they almost always involve some kind of reweighting by the pollster. So while the pollster is the best equipped to determine how to reweight their own poll, the validity of the method shouldn’t be taken on faith.
Finally, early voting has been consistent with the fundamentals and polling, in that the trends look favorable to the Republican candidate. In Pennsylvania, for example, Democrats hold a +408,910 vote advantage in early voting in 2024 compared to a +1,040,038 vote advantage in early voting in 2020. The trend is similar in other states.
The difficulty with interpreting early vote numbers, especially when they differ this much from the previous cycle, is that they most likely indicate a behavioral change more than a definitive indicator of the final voting demographic. It’s pretty obvious that Republicans are voting early more than they ever have. Less obvious is whether (i) Democrats are voting early at lower frequency than usual, and whether this will be made up on election day and (ii) how much of the election day vote (which is usually overwhelmingly favors the Republicans) has been cannibalized by the early voting. Well-known modelers, such as Silver, have written early voting numbers off as useless. While I agree that the uncertainty surrounding these numbers explains why the early voting numbers have a somewhat muted impact on the final forecast, it is almost never correct to call a piece of data “useless” simply because you don’t know how to model it. Overall, the early vote information is optimistic for the Republicans, even if it is hard to interpret, and therefore accounts for an extra 1-2% bump in Trump’s favor in the final forecast.
So what do we make of all this?
The forecast makes Trump about a 2-to-1 favorite (-201 for the sports bettors out there), based on an analysis of fundamental data, polls, and early voting data. This is more or less in line with other opinions out there, such as the betting markets and other forecasters. But because this forecast likes Trump a bit more than markets and a bit more than the other forecasters (who are favorable to Harris), it is inevitable that I will be called an idiot, or worse, should Harris pull it out. The same people will still call me an idiot if Trump wins, so what’s the difference.
That’s why we have betting markets, to settle these disagreements in a civilized way. It goes without saying, 2-to-1 favorites lose all the time.


good post gl with bets today 🤝